Query Builder
Query Builder
The Query Builder in Cost Explorer allows you to create custom cost analyses by combining filters, groupings, and date ranges.
Accessing Cost Explorer
Navigate to Cost Explorer in the main menu. The page shows your filter controls and the results (chart and table) all in one view. Adjust the filters and the results update automatically.
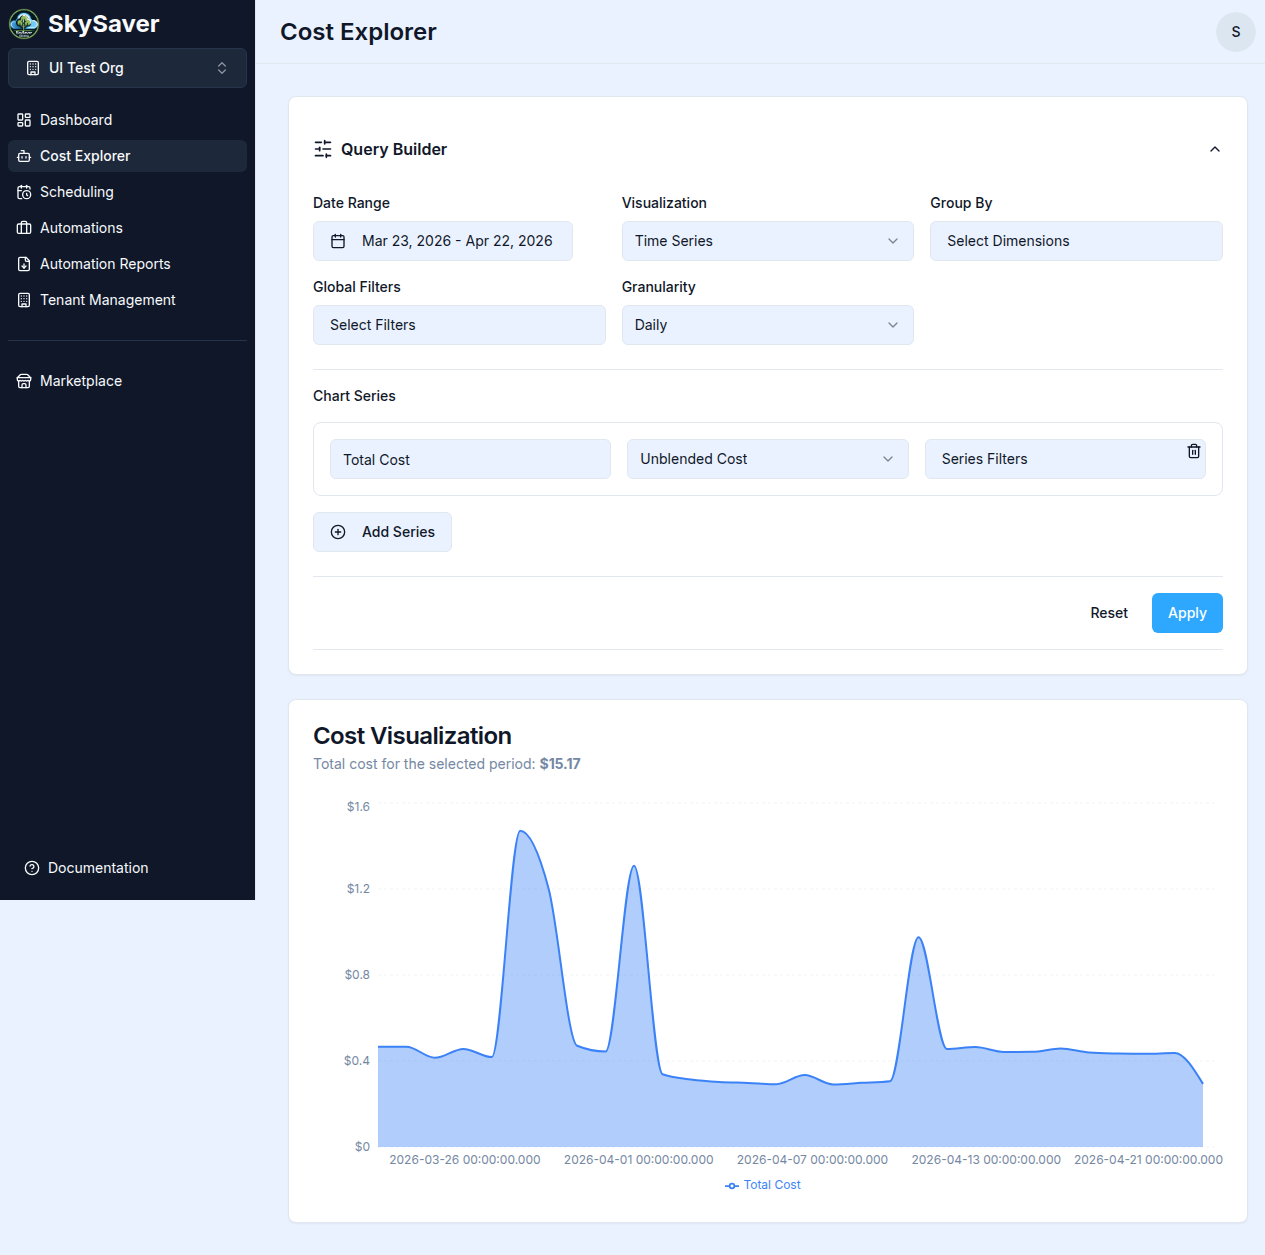
Query Components
Date Range
Select the time period for analysis using the calendar date picker. Click the date range field to open the calendar and choose a start and end date.
Filters
Narrow down results by dimension:
| Filter | Description |
|---|---|
| Service | AWS service (EC2, RDS, S3, Lambda, etc.) |
| Account | AWS account ID |
| Region | AWS region |
| Usage Type | Specific usage categories |
| Operation | AWS operation type |
| Instance Type | EC2/RDS instance type |
| Availability Zone | Specific AZ |
| Resource ID | Individual resource identifier |
| Tag | Cost allocation tags (prefix with tag:) |
Multiple Filters
Combine filters for precise analysis:
Service = EC2
  AND Region = us-east-1
  AND Tag:Environment = production
Group By
Choose how to aggregate costs:
| Group By | Result |
|---|---|
| Service | Costs per AWS service |
| Account | Costs per AWS account |
| Region | Costs per region |
| Usage Type | Detailed usage breakdown |
| Availability Zone | Costs per AZ |
| Operation | Costs per AWS operation type |
| Instance Type | Costs per EC2/RDS instance type |
| Resource ID | Costs per individual resource |
| Environment Tag | Costs grouped by the Environment tag value |
| Application Tag | Costs grouped by the Application tag value |
Note: Tag-based Group By dimensions (Environment Tag, Application Tag) require the corresponding cost allocation tags to be activated in your AWS Billing Console and enabled in Project Defaults.
Granularity
Choose the time granularity for time series data:
| Granularity | Description |
|---|---|
| Daily | Day-by-day cost breakdown (default) |
| Weekly | Week-by-week cost breakdown |
| Monthly | Month-by-month cost breakdown |
Visualization Type
Choose how to display query results:
| Type | Description |
|---|---|
| Time Series | Line chart showing costs over time |
| Pie | Pie chart for proportional breakdown |
| Bar | Bar chart for comparative analysis |
| Stacked | Stacked area chart for cumulative trends |
| Table | Tabular view of raw results |
Metric (Chart Series)
Choose which cost metric to display:
| Metric | Description |
|---|---|
| Unblended Cost | Standard AWS cost (default) |
| Blended Cost | Cost averaged across reserved and on-demand usage |
| Usage Amount | Resource usage quantity instead of dollar cost |
Building a Query
Example 1: EC2 Costs by Region
- Date Range: Select the previous month
- Filters: Service = Amazon EC2
- Group By: Region
- Run Query
Example 2: Production Environment Costs
- Date Range: Select the last 3 months
- Group By: Environment Tag
- Run Query
Example 3: Account Comparison
- Date Range: Select the last 6 months
- Filters: None (all accounts)
- Group By: Account
- Run Query
Understanding Results
Table View
Results display in a table with:
| Column | Description |
|---|---|
| Dimension | Grouped values (service, account, etc.) |
| Cost | Total cost for the period |
| % of Total | Proportion of total spend |
| Change | Difference from previous period |
Chart View
Visualizations available:
- Line Chart - Trends over time
- Bar Chart - Comparative analysis
- Pie Chart - Proportional breakdown
- Stacked Area - Cumulative trends
Exporting Results
CSV export from Cost Explorer is not yet available. To export cost data, use the AWS Cost Explorer console directly or download reports via Automation Reports.
Query Tips
Performance
- Shorter date ranges run faster
- Fewer filters = faster queries
- Large accounts may have query limits
Accuracy
- Data has 24-48 hour delay
- Forecasts are estimates
- Credits/refunds may appear later
Common Query Patterns
| Goal | Filters | Group By | Granularity |
|---|---|---|---|
| Service breakdown | None | Service | Monthly |
| Regional analysis | None | Region | Monthly |
| Account comparison | None | Account | Monthly |
| Daily spend trends | None | Service | Daily |
| Environment costs | None | Environment Tag | Monthly |
Troubleshooting
| Issue | Cause | Solution |
|---|---|---|
| No results | Filter too restrictive | Broaden filters |
| Slow query | Large date range | Narrow date range |
| Missing data | Tag not activated | Enable cost allocation tag |
| Zero costs | Wrong filter value | Verify filter values |
Related Topics
- Cost Allocation Tags - Tag-based analysis
- Dashboard Widgets - Pre-built visualizations
- Cost Explorer Overview - Feature overview